

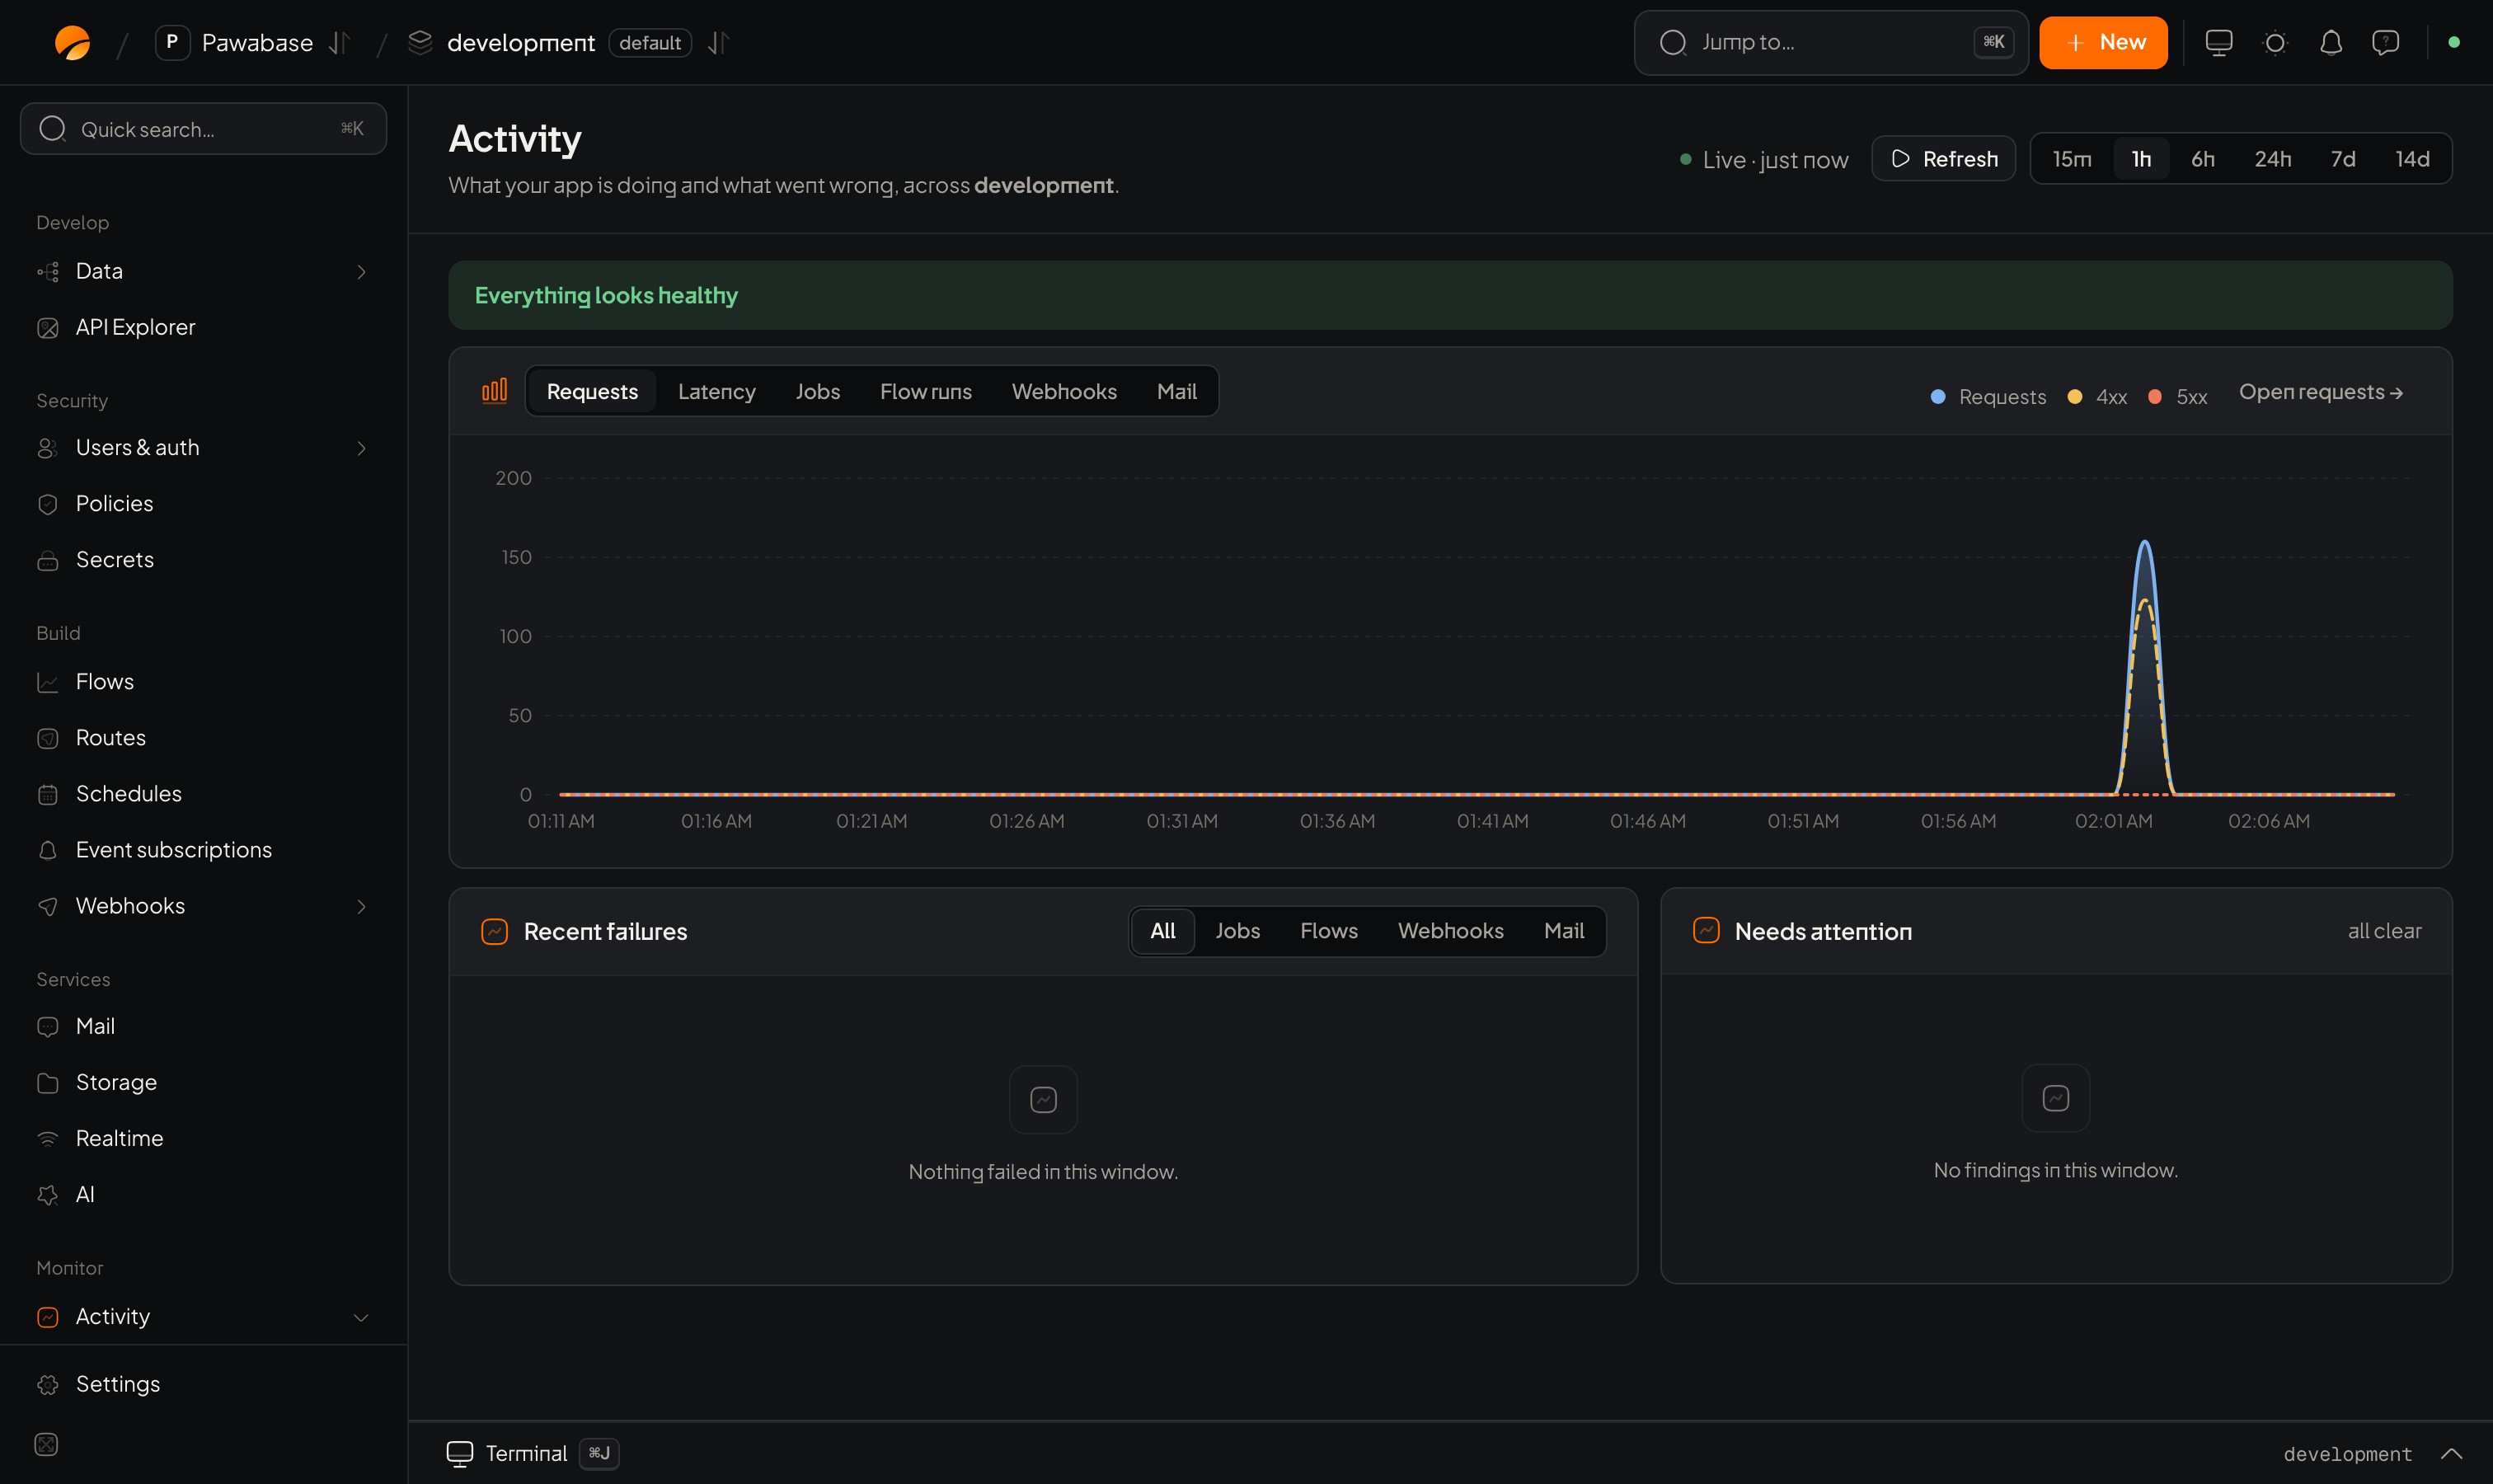
Activity → Overview: traffic, recent failures and what needs attention.
The pages
A dot next to a page means it has findings in the current window, so you know where to look before you click.
Time windows
Pages that summarise a period share the time buttons 15m, 1h, 6h, 24h, 7d and 14d. Live keeps the page refreshing; Refresh updates it now. How far back you can look depends on how long your plan keeps request logs and runs (Plans and limits).The Overview
- The banner says Everything looks healthy, or what isn’t.
- The chart switches between Requests, Latency, Jobs, Flow runs, Webhooks and Mail over the window, with requests split into successes, client errors (4xx) and server errors (5xx). Open requests jumps to the matching requests.
- Recent failures lists the latest failed jobs, flow runs, webhook deliveries and emails, filterable by kind.
- Needs attention lists findings in plain words:
Nothing needs attention in this window means there are no findings.
The environment overview
The environment’s own Overview page (the first item in the sidebar) is a lighter summary: requests, average latency, bandwidth, flow runs, jobs and events over the last day, recent requests, and the project’s id and API address. Use it as a home page; use Activity to dig in.Common investigations
”A user says something failed”
- Ask for the time, or better, the request id your app shows in its error (
error.requestIdin the SDKs). - Requests: search for it and open the trace.
- Read the status and the access-rule decision. A
403names the rule that refused. - Follow the trace to any jobs, flow runs or emails it started.
”It’s slow”
- Routes: sort by slowness and open the slowest route.
- Where the time goes splits time between the database, flows and other work.
- Open one of the slowest requests and read its waterfall.
- Look for many small database queries, a slow HTTP call in a flow, or a missing index.
”Did the release break anything?”
- Overview with a window starting before the release: compare error rate and latency.
- Errors: any new groups?
- Flow runs and Jobs: new failures?
- Audit log: what changed, and who changed it.
”Something happened that shouldn’t have”
- Audit log: which setting or definition changed?
- Events: what fired, and what did it reach?
- Event map: is something reacting to an event you didn’t expect?
Get told instead of looking
Activity shows you; alarms tell you. Set a few on error rate, latency, failed jobs and mail failures, and publish a status page so your users know too.Privacy
Activity holds request details, payloads, logs and email contents, which can include personal data. Limit who opens Studio in production, use scoped keys for integrations that read monitoring data (monitoring:read), and keep personal data out of what your flows log.
Requests and traces
Follow one call end to end.
Flow runs, jobs and events
Watch background work.
Logs, metrics and alarms
Get told when something is wrong.
Status page
Tell your users how you’re doing.
Audit log
Who changed what.
Debugging rules
Follow a refusal.